Making sense of relationships among values and comparing those values is primary action for our day to day business-decisions. Whether you want to compare sales revenue across different channels, regions or products- presenting data in a visual form reduces the cognitive load on our brain and makes it simple to understand. Two way tables are best suited for categorial comparison. Take a look at the table below.

Now, take a look at the visual representation of the same data.
Data Visualization
Of course the visual representation is quick to comprehend. We have already discussed preattentive attributes that we can leverage to quickly make sense out of visually represented data. Let’s see how some simple visual patterns can simplify data analysis at a glance.
Categorial comparison
Using bar charts are great for comparisons. Simply when you look at anything that is similar to the following image you tend to notice the hight-difference between them and later you look for the legends that may set the context for these bars individually. For example, you may be comparing marketing campaign success levels for different regions by mining tweets.
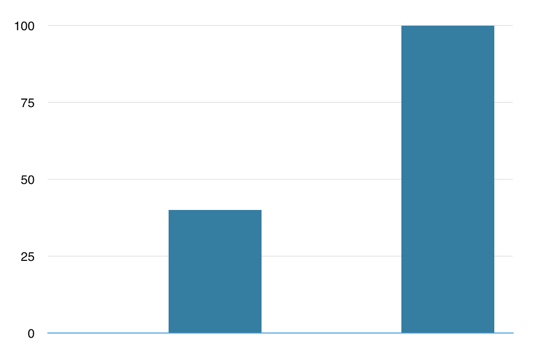
bar chart
You can add comparisons for different channels, such as facebook and twitter, used in the marketing campaign and compare them as well. By using additional bars, for channels, you can leave categorial comparisons up to the user.
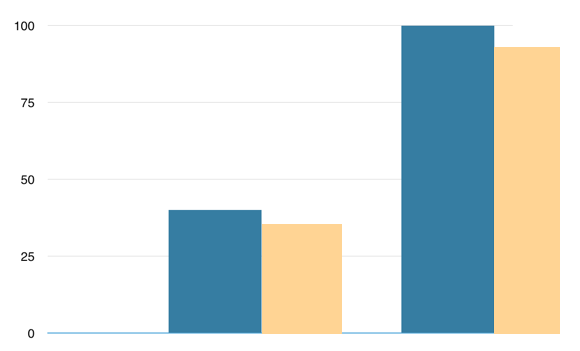
Categorical comparison
However, when comparing very high number of categories on the same bar chart will simply not solve its purpose. In such cases, treemaps are the way to go and quickly answer many visual queries.
Finding Trends
When you see following pattern in charts you are sure to interpret it as a sign of increase.
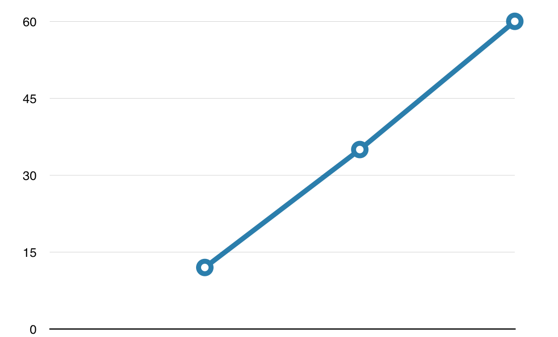
Data Visualization using line chart
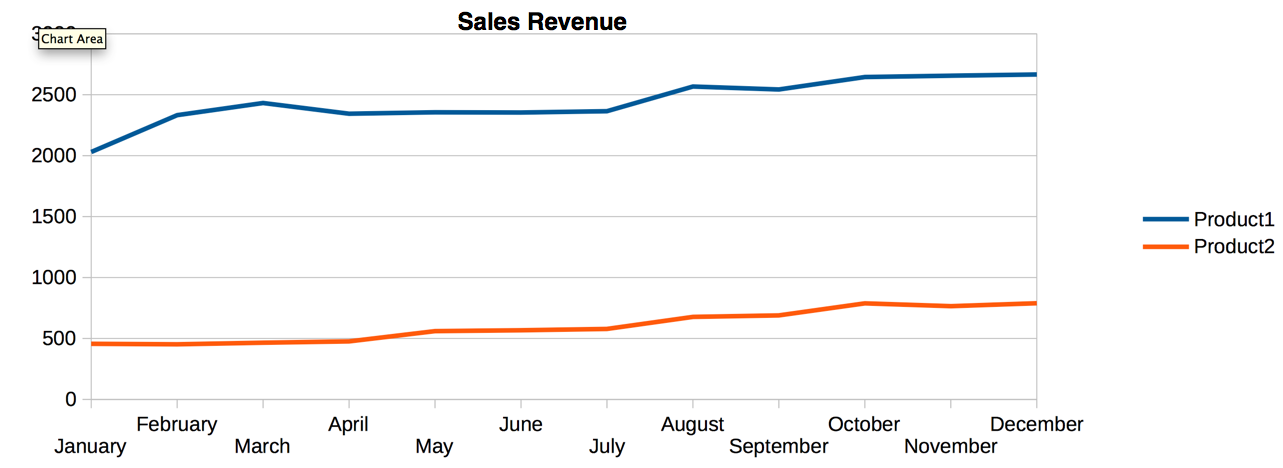
Line charts are great for spotting changes over period of time. Other then finding increasing or decreasing trends you can see patterns emerging to show fluctuation or repetitions. Findings data patterns with steep or gradual increase can say a lot about the data on whatever context such visualisation are prepared.
For example, comparing sales data that changed over the period of time for one product with another product that was launched for the same customer segment.
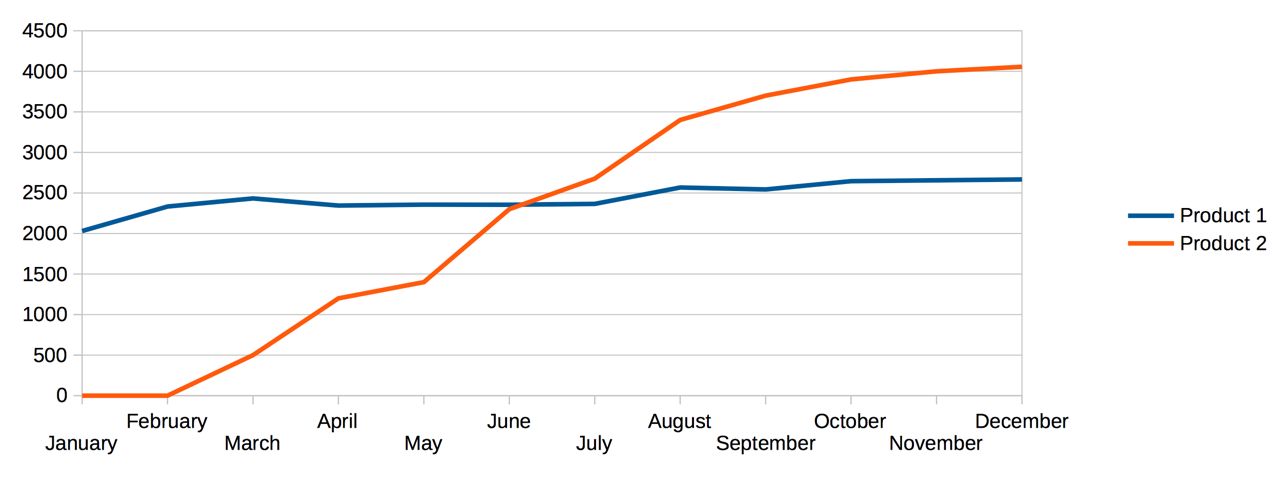
Comparing trends
Here, intersection of the line is enough to find that the product2 one has taken over the sales of product1 by the month of June.
Interestingly, you can compare trends by using multi axis line charts. Here two different scales for y-axis are used to represent data for two distinct datasets. This allows the user to see the difference between trends-increasing trend vs decreasing trend. Here, intersection of two trend-lines do not represent any specific meaning!
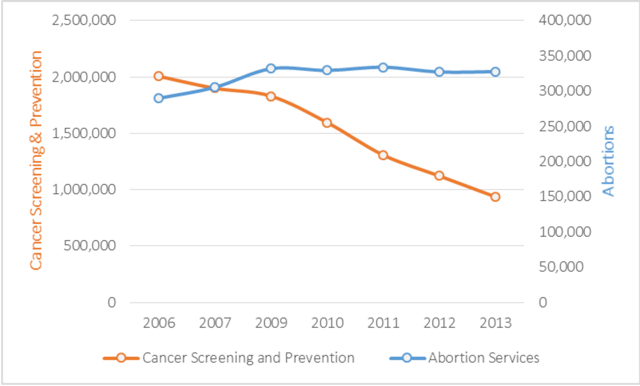
Trend comparison
Further, using sparklines that represent the trend over the period of time without the need to any axis is a great way to get the information at glance.
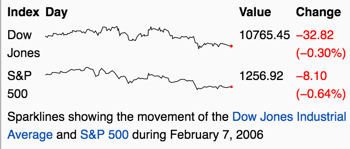
sparkline for trends
Splitting data into small multiple charts, also referred to as trellis or small multiples, are a great way to examine values and patterns because each graph is place in close proximity.
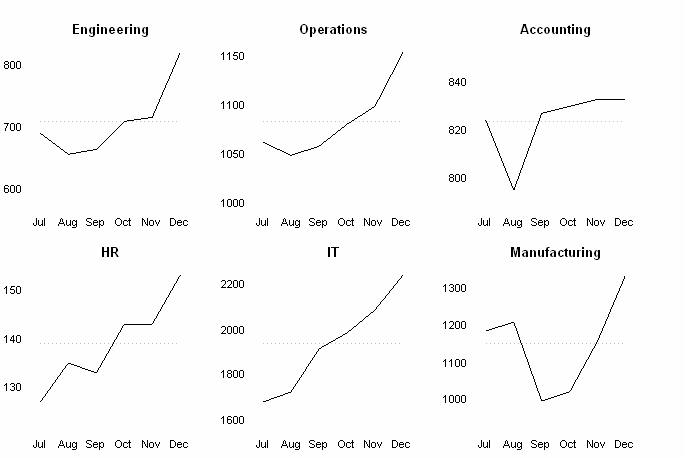
small multiples
For example, in the above chart salary expenses are represented by each department over the period of time. Salary expenses of the IT department has been growing consistently over the period of time whereas it remained stable for Accounting department from September onwards.
Part of whole
Pie charts are great to visualize part of whole. However, as the number of slices increase it is likely that you may have slices that are very close to each other that makes it difficult to differentiate. One of the best way to visualize part of whole is stacked bar charts that allows to compare categorial values over the period of time.
Sales data represented as stacked bar chart allows to quickly make your point clear that in the month of March, ‘East’ zone was the one where most sales happened. Similarly in the month of February, South Zone made lowest sales.
We have seen how categorical comparison, finding trends as well as multiple categorical comparison to find the part of whole is quickly possible just by representing data in simple visual format. There are number of other advance visualizations to reduce cognitive load from your brain and simplify analysis by finding the right pattern from data, especially for multidimensional data. We will discuss many more ways to visualize data and emerging patterns in upcoming posts.